


Photo Vault Dashboard — Ad Performance Analytics Platform
Project Overview
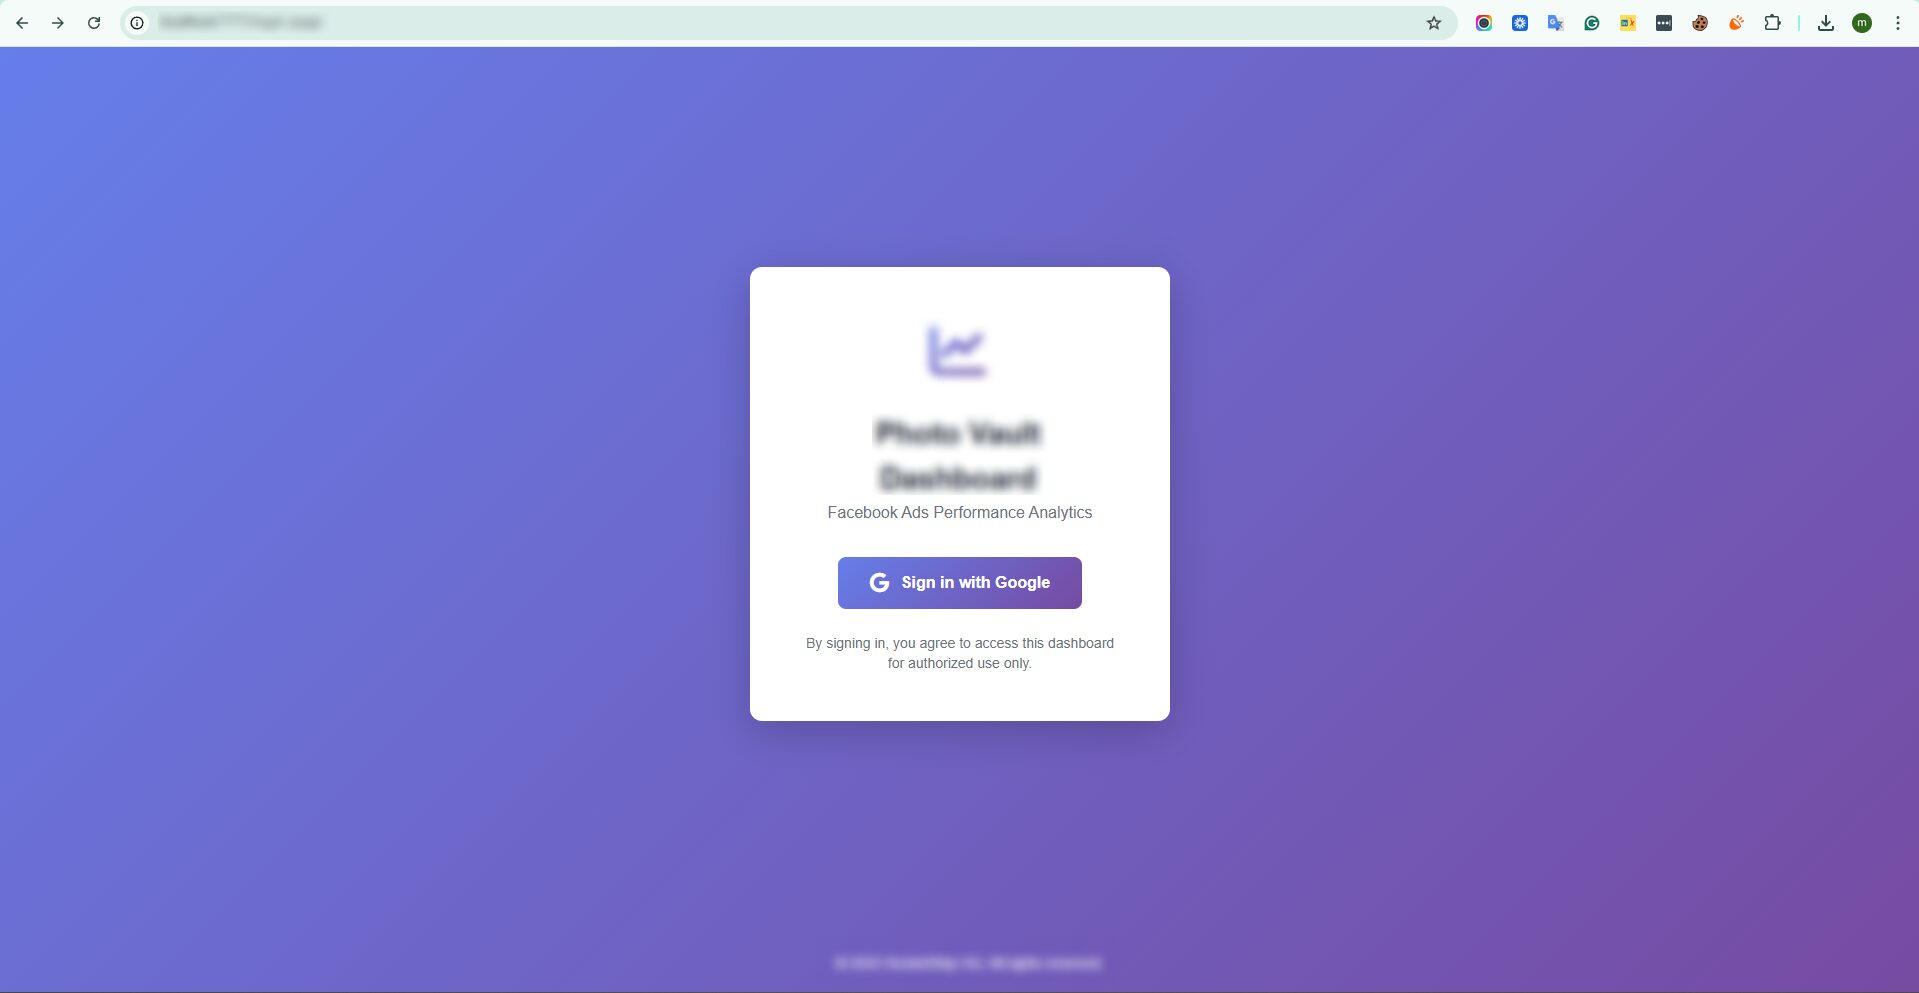
The Photo Vault Dashboard is a specialized analytics platform built to track, visualize, and optimize digital advertising performance—primarily focusing on Meta/Facebook ad campaigns. The platform consolidates key performance metrics, creative insights, placement effectiveness, and demographic data into a single, easy-to-understand interface, enabling marketers to make informed, data-driven decisions.
Core Goal
To centralize and visualize ad performance data so marketers can quickly evaluate creative effectiveness, optimize campaign targeting, and improve overall advertising efficiency.
Target Users
- Performance Marketers
- Media Buyers
- Creative Strategists
- Agencies managing multiple ad campaigns
- Growth teams running data-backed creative optimization
Key Features & Functional Capabilities
1. Data Selection & Filtering
Date Range Selector
A key control allowing users to select the specific time frame for analysis—such as daily, weekly, or monthly performance windows.
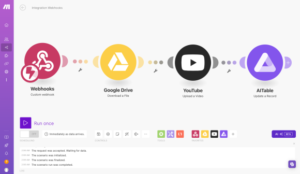
Source Integration
Data is sourced directly from the Photo Vault ad service, ensuring accurate and real-time performance tracking.
These filters enable users to customize their analysis and compare performance across different periods.
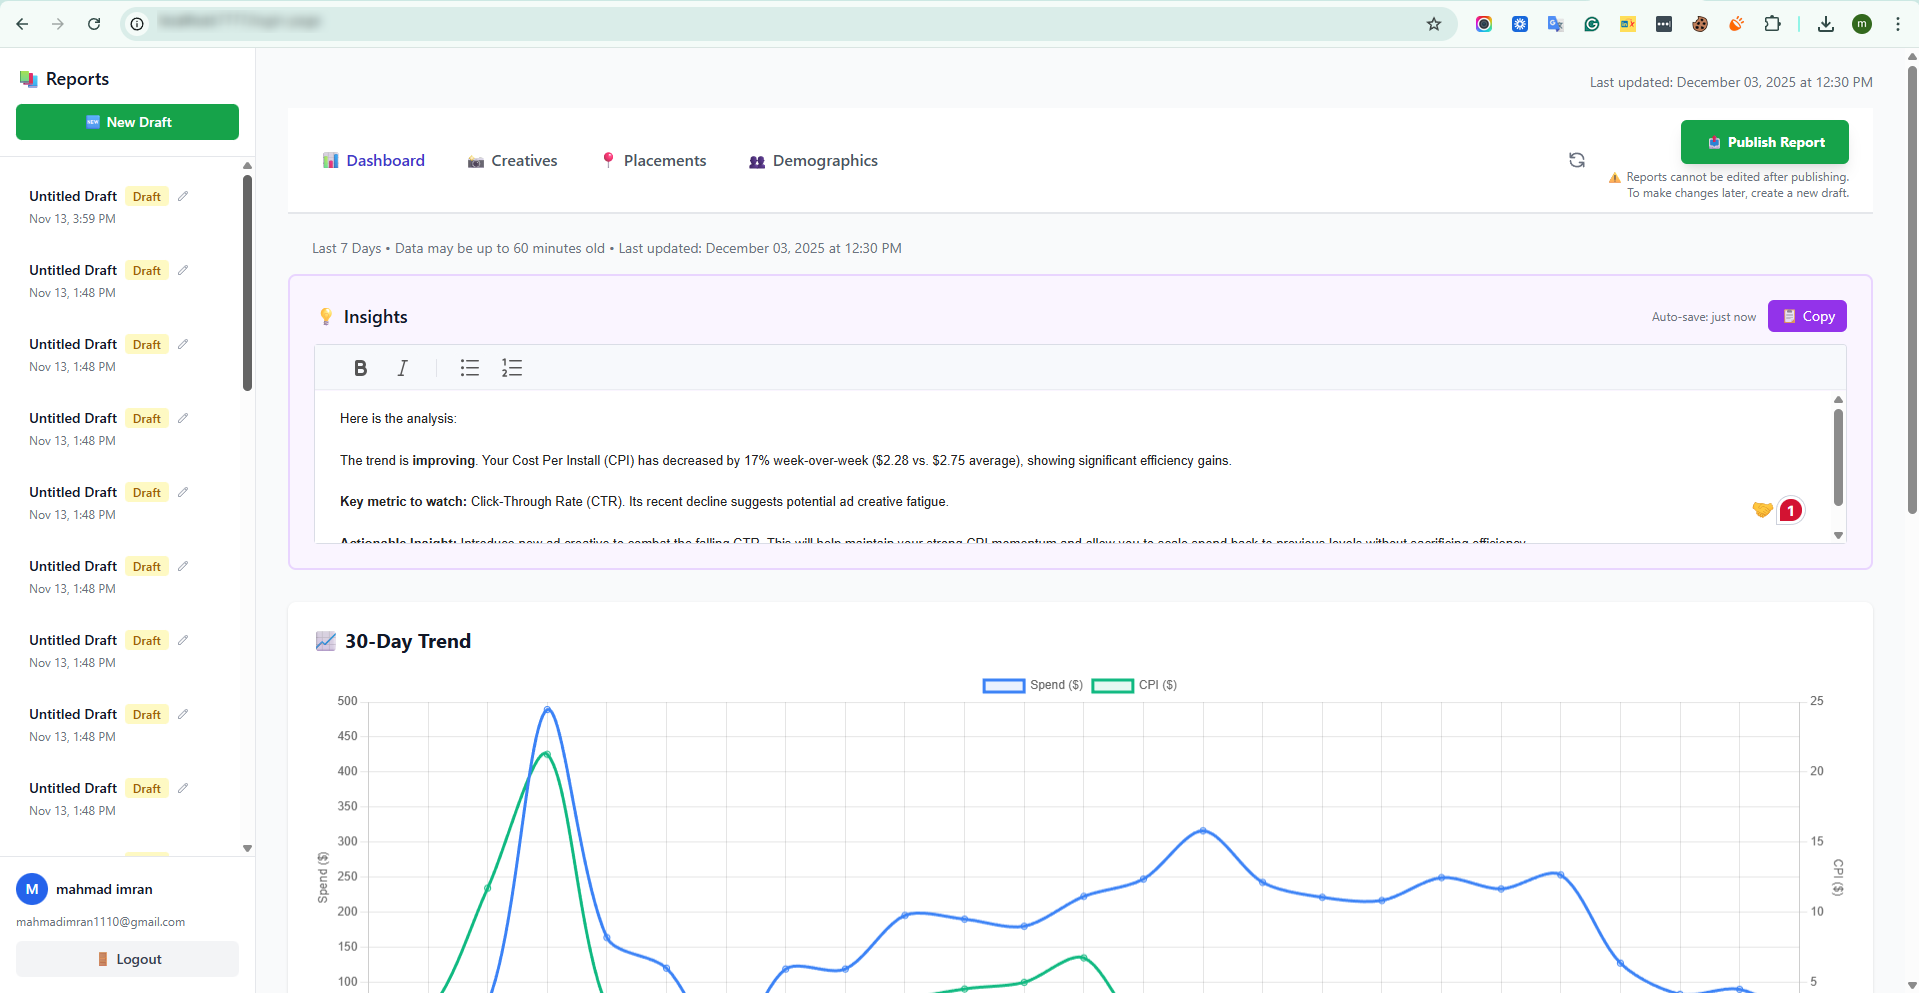
2. Top-Level Performance Metrics
Prominently displayed at the top of the dashboard, these metrics provide an immediate overview of campaign health:
Metric | Purpose |
Total Cost | Total ad spend during the selected time frame |
Impressions | Number of times ads were displayed |
Reach | Unique users who saw the ads |
Link Clicks | Total number of CTA clicks |
CPM (Cost Per Mille) | Cost per 1,000 impressions |
Cost Per Link Click | Average cost to generate each link click |
These KPIs ensure users can quickly assess both spend efficiency and engagement performance.
3. Breakdown & Analysis Views
The dashboard includes multiple segmented analysis panels to help marketers pinpoint areas for optimization.
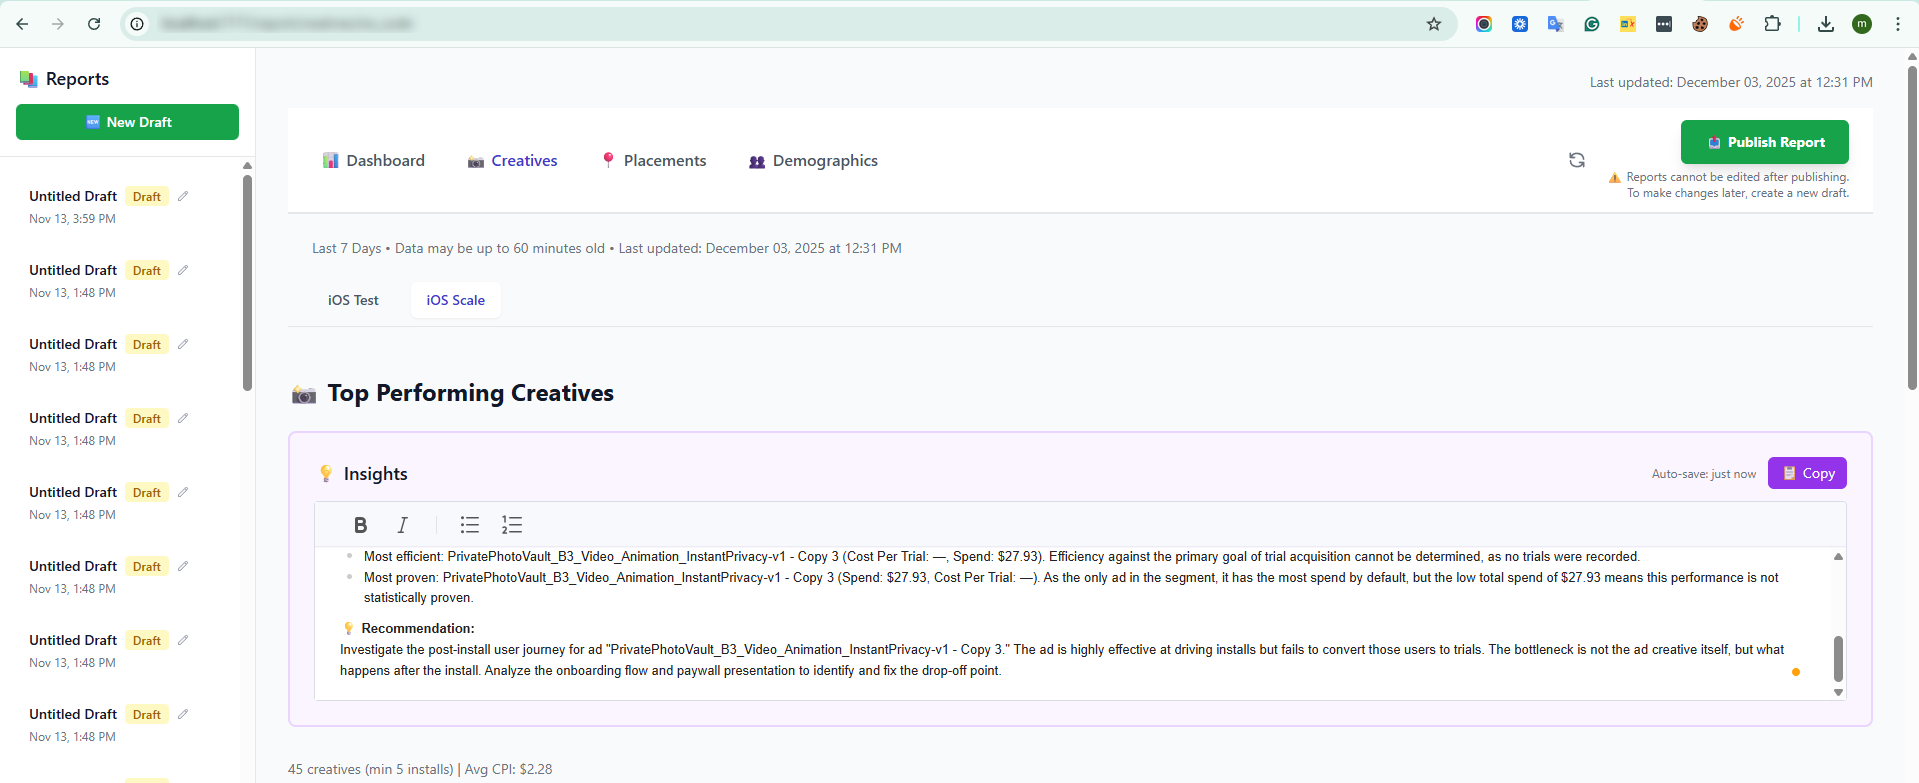
Creative Analysis (A/B Testing View)
A central table lists each creative unit—images, videos, or variations of ad copy.
Users can compare performance metrics such as:
- Impressions
- Reach
- Clicks
- Cost
- CPM
- CTR
This comparative breakdown helps teams identify winning creatives and retire underperforming ones.
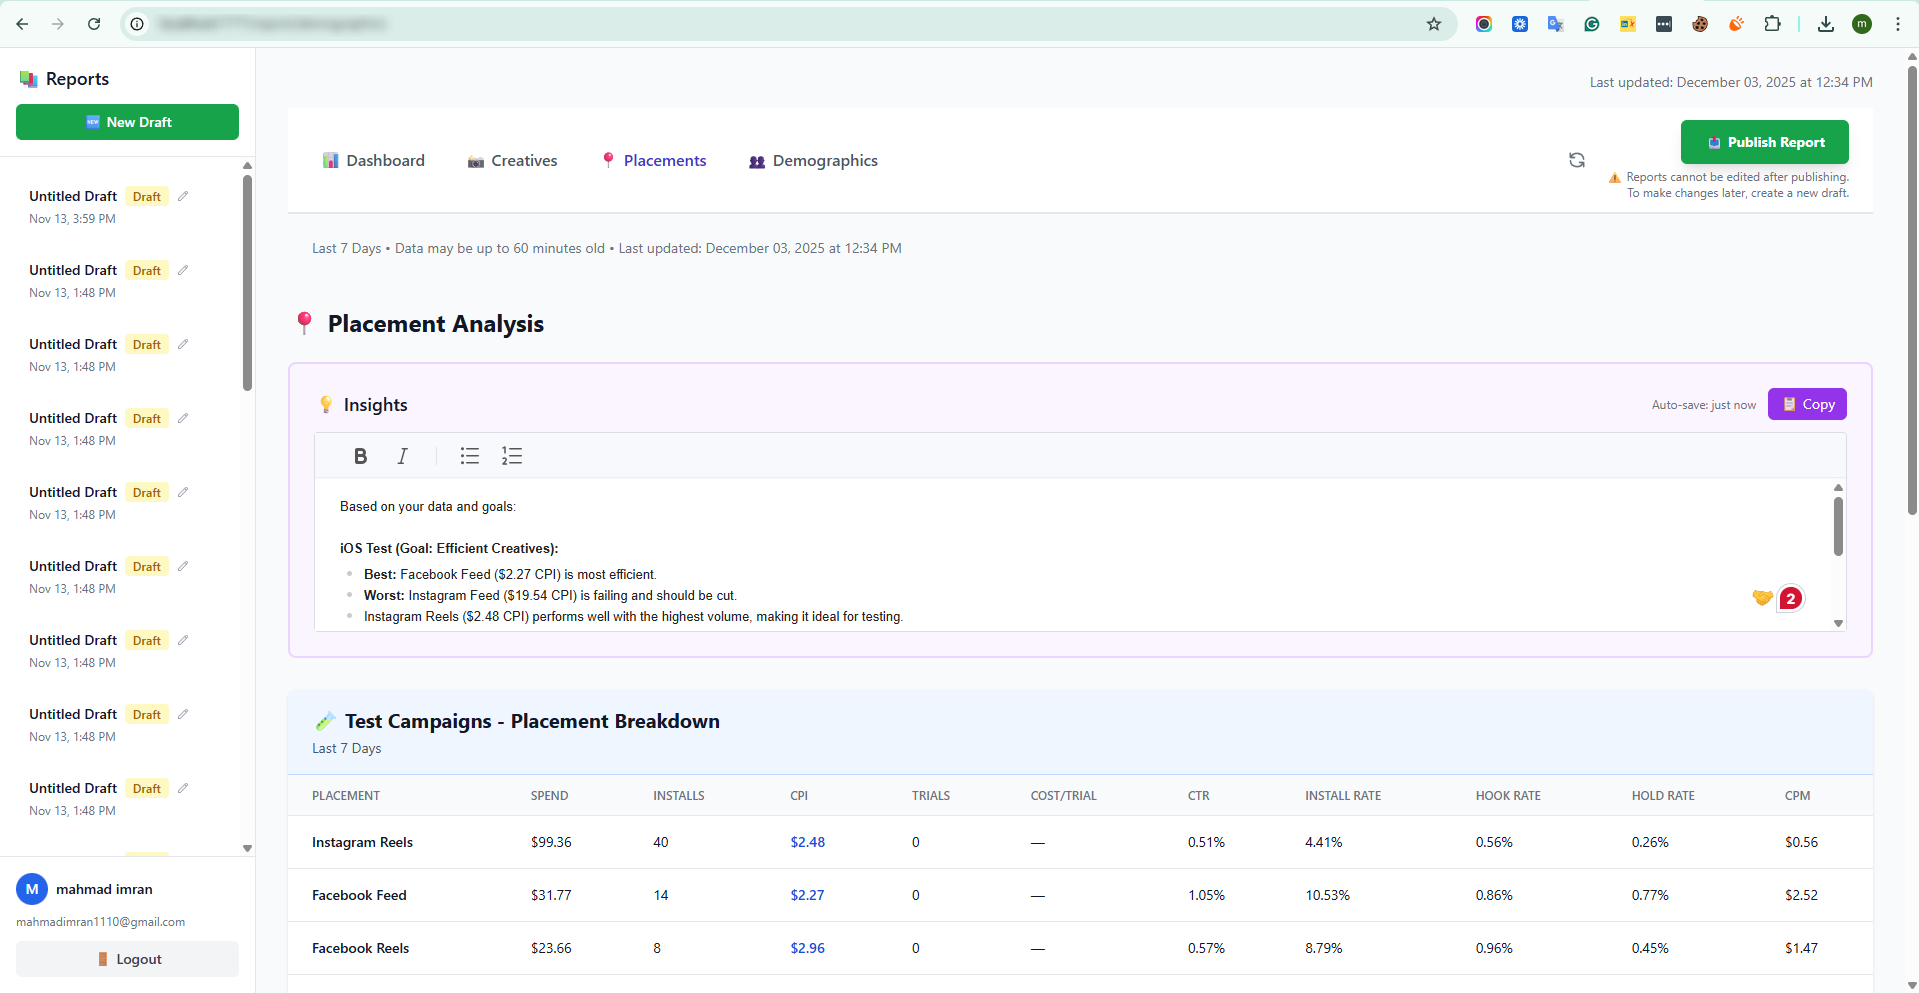
Placement Performance Visualization
A bar-chart visualization shows performance by placement, such as:
- Facebook
- Instagram
- Messenger
- Audience Network
This view highlights which platforms deliver the best cost efficiency, engagement, and reach—allowing marketers to fine-tune their placement strategy.
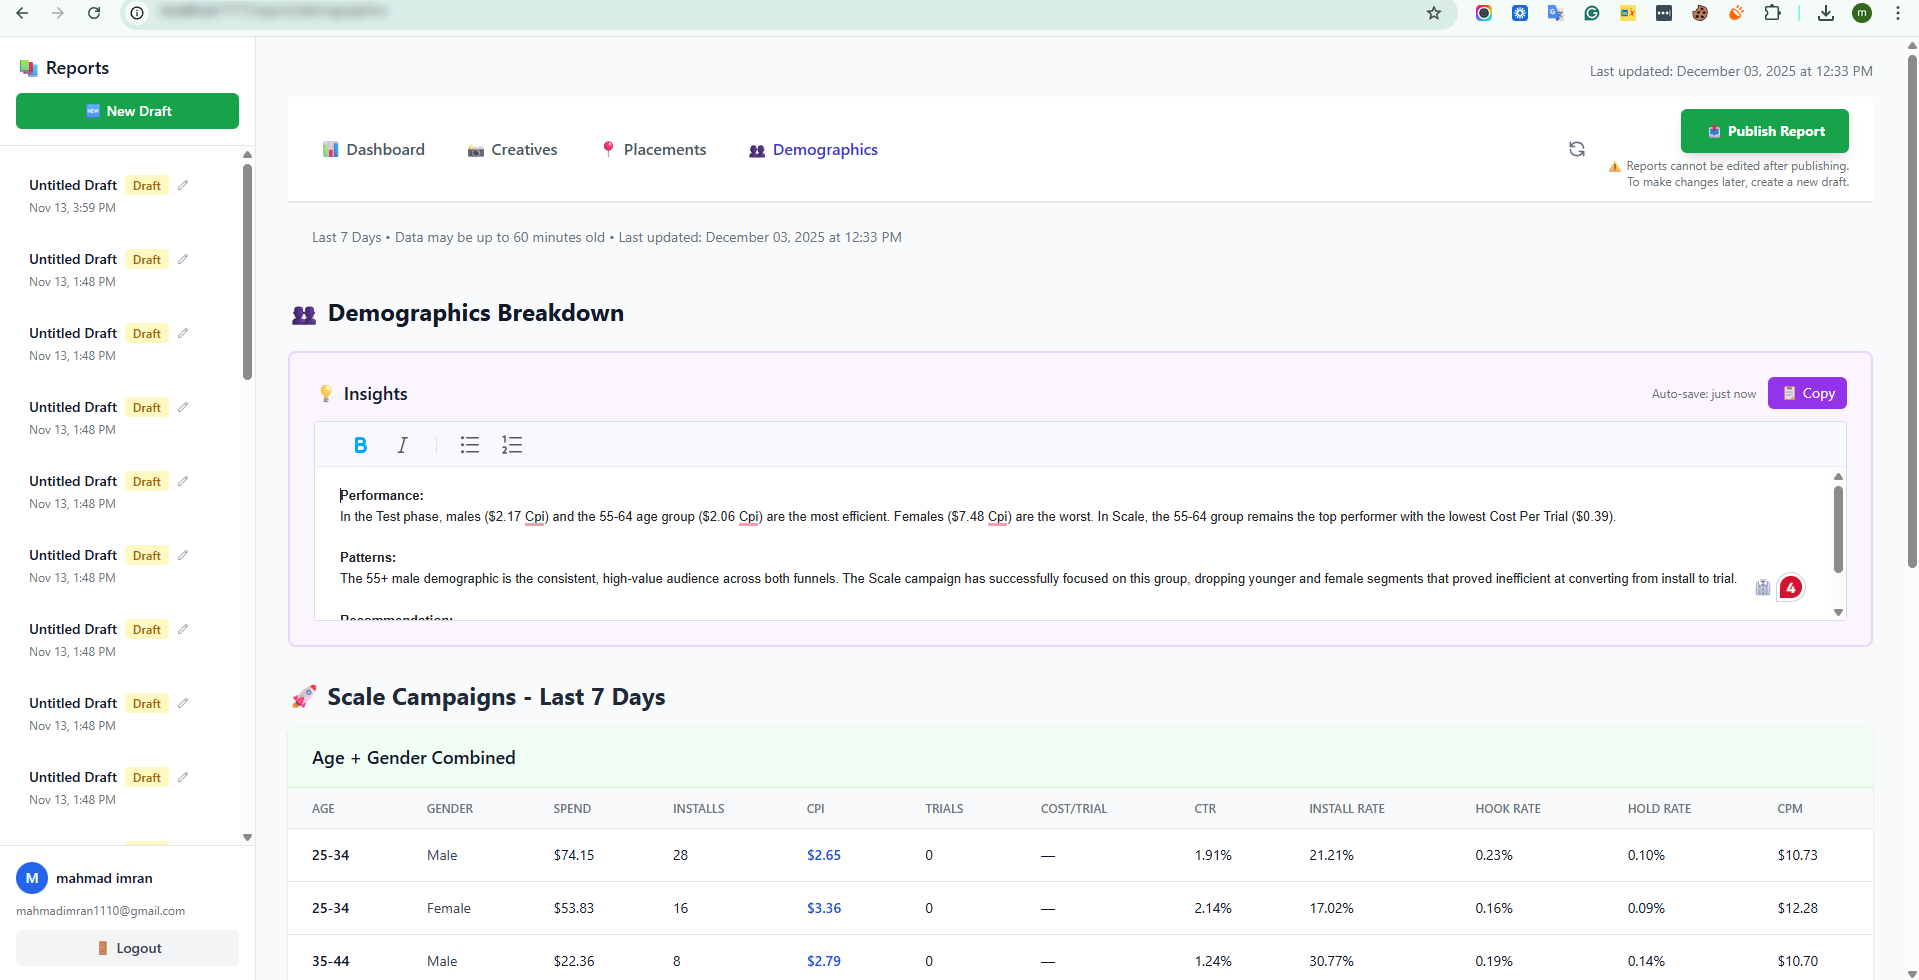
Demographic Insights (Age & Gender)
Visualizations—often pie charts or segmented bar charts—break down ad performance across demographic groups:
- Age Groups
- Gender
These insights help confirm whether ads are reaching the right audience and can guide more precise targeting adjustments in the ad platform.
Conclusion
The Photo Vault Dashboard streamlines the complex process of analyzing and optimizing digital advertising campaigns. By centralizing key performance metrics, creative insights, placement data, and demographic information into an intuitive interface, it enables marketers, media buyers, and creative strategists to make fast, informed decisions. With robust filtering, detailed creative comparisons, and actionable visualizations, the platform empowers users to identify high-performing ads, optimize spend, and target audiences more effectively. Ultimately, the Photo Vault Dashboard transforms raw ad data into clear, strategic insights, helping teams maximize campaign performance and drive measurable growth.